In today’s data-centric world, the ability to convey complex information effectively is vital. Exploratory Data Analysis (EDA) is your compass for navigating the intricacies of datasets, empowering you to uncover hidden insights and trends. In this comprehensive guide, we will embark on this data adventure together, learning to explore data systematically, ask the right questions, and make sense of the answers.
Understanding the Essence of EDA
Exploratory Data Analysis begins with a preliminary examination of your data. Think of it as your bird’s-eye view, where you understand the data’s structure, size, and potential issues. Here are the fundamental steps:

- Preliminary Data Examination: Get acquainted with your data. What does it look like? What are its key characteristics?
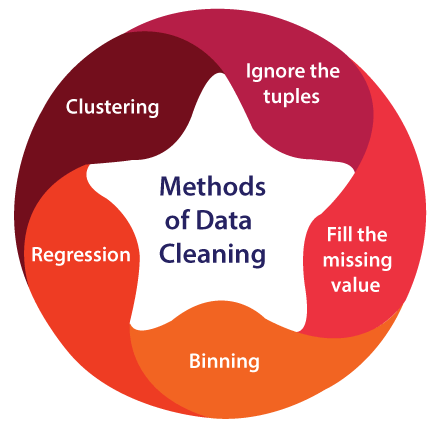
- Data Cleaning: Identifying and rectifying missing values, outliers, and inconsistencies is crucial to ensure data integrity.
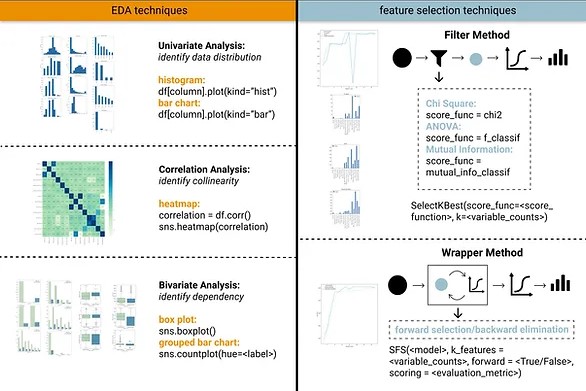
- Univariate Analysis: In this phase, you dive into individual variables, exploring their distributions and characteristics. Techniques like histograms, box plots, and summary statistics come in handy.
- Bivariate Analysis: It’s time to delve deeper into pairs of variables. What are their relationships? Scatter plots, correlation matrices, and pivot tables are valuable tools.
- Multivariate Analysis: For more complex insights, extend your analysis to multiple variables simultaneously. Techniques like Principal Component Analysis (PCA) can help reduce dimensionality and make the data more manageable.
Visualizing the Story
Data visualization is your storytelling medium. It’s through visualizations that data begins to reveal its tales, patterns, and intricacies. Some visualization techniques to keep in your arsenal include:
Data Visualization: Create compelling visualizations that narrate your data’s story. Bar charts, heat maps, and interactive plots are your allies in this endeavor.
Exploring Data Distribution: To understand data distribution, tools like histograms, kernel density estimations, and quantile-quantile (Q-Q) plots come to the rescue.
Correlation Heatmaps: Visualize correlations between variables through heatmaps, making it easier to spot and comprehend relationships.
Techniques and Tools
Unveiling the true essence of Exploratory Data Analysis requires understanding the techniques and tools that empower your exploration:

- Summary Statistics: Use basic statistics like mean, median, and standard deviation to comprehend central tendencies and the spread of your data.
- Box Plots: These diagrams offer a comprehensive visual overview of your data, revealing the distribution, outliers, and quartiles in one visualization.
- Outlier Detection: Identifying and managing outliers is essential. Outliers can skew your analysis, and addressing them ensures data accuracy.
- Data Transformation: Techniques like normalization and log transformation can reshape data to make it more amenable to analysis.
The Power of EDA (Exploratory Data Analysis)
The transformative shift to Exploratory Data Analysis has a profound impact on decision-making. Organizations can now make more informed choices, optimize operations, and stay ahead of the competition. By leveraging EDA, they gain a competitive advantage that traditional analytics alone cannot deliver.
Pattern Discovery: EDA is your torchlight in the dark cave of data. It unveils hidden patterns, outliers, and relationships that might not be immediately evident, shining a light on potential data insights.
Data Quality Assurance: By scrutinizing data during the EDA process, you can identify and rectify errors, inconsistencies, or missing values, ensuring the data’s quality and trustworthiness.
Decision Support: EDA enhances your understanding of the dataset, providing the foundation for making data-driven decisions. It doesn’t just describe data; it equips you with the knowledge needed to act upon it.
Feature Selection: In the realm of machine learning, EDA plays a pivotal role in guiding feature selection. By exploring the relationships between features and the target variable, you can make informed decisions on which variables are most influential in predictive modeling.
Time and Cost Efficiency: While it may seem like an additional step, EDA is a time and cost-saving measure in the long run. By detecting data issues early on, you prevent errors that could be expensive and time-consuming to rectify downstream.
The Practical Approach
Embracing EDA is a hands-on journey. Actively engage with your data, whether using tools like Jupyter Notebook, Python, or R, to perform your Exploratory Data Analysis. Remember, it’s not a linear process. Be prepared to revisit and refine your analysis as you gain more insights.
Conclusion
Exploratory Data Analysis is more than just a preliminary step; it’s a dynamic and powerful approach for extracting meaningful insights from data. Armed with Exploratory Data Analysis techniques and tools, you can confidently navigate complex datasets, revealing their stories and making informed decisions. Start your EDA journey today and unlock the hidden treasures within your data. Now, over to you: it’s time to embark on your EDA journey and unlock the power of data exploration.

Explore further with our external resources or deepen your knowledge with our other data analysis guides.


