Introduction to Data Visualization Evolution
Data visualization has undergone a significant transformation over the past few decades, evolving from simple charts and graphs to sophisticated tools that offer deep insights and interactive experiences. This blog explores the journey of data visualization tools and anticipates what the future holds beyond the current giants, Tableau and Power BI.
The evolution of data visualization is a testament to the field’s adaptability and growth in response to technological advancements and changing data needs. As we progress, the line between data visualization and data interaction is blurring, with tools not just representing data but also allowing users to manipulate and explore it in real-time, providing a more dynamic and engaging experience.
The Current Landscape: Tableau and Power BI
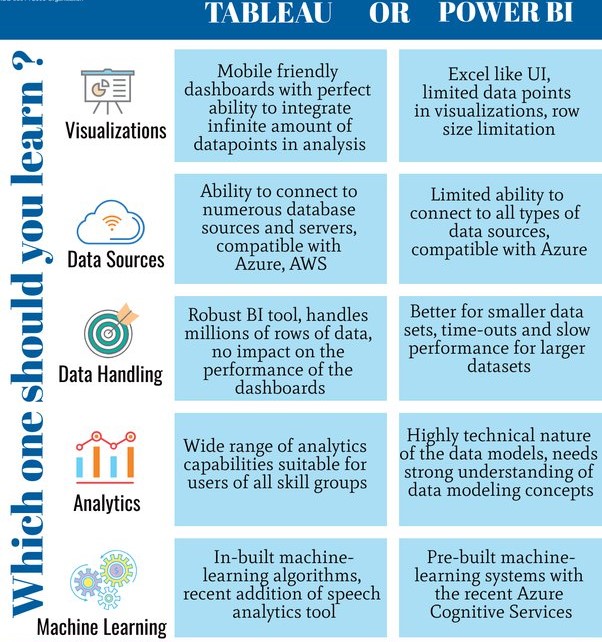
Tableau and Power BI have set high standards in the data visualization domain, equipping users with powerful tools to transform raw data into meaningful insights. Their user-friendly interfaces, combined with robust analytics capabilities, have made them leaders in this space, catering to a wide range of users from different industries.
These platforms have democratized data visualization, enabling not just data scientists but also non-technical users to create complex visualizations. However, as user needs evolve and data becomes more intricate, the demand for more advanced tools grows, signaling a new era in data visualization that may extend beyond what Tableau and Power BI currently offer.
Overview of Tableau and Power BI
Tableau is renowned for its intuitive drag-and-drop interface and powerful data storytelling capabilities, while Power BI is celebrated for its integration with Microsoft’s suite of products and its affordability. Both platforms provide extensive customization options and a rich set of features that cater to a variety of data visualization needs.
Yet, despite their strengths, both tools have their own set of complexities and learning curves. Users often need to undergo significant training to utilize these tools to their full potential, highlighting a gap that future data visualization tools might bridge.
- The strengths and popularity of Tableau and Power BI in the industry.
- Key features and capabilities that set these tools apart.
Limitations and Challenges of Tableau and Power BI
One notable limitation of current tools is their scalability and performance issues when dealing with massive datasets or real-time data streams. Users often encounter bottlenecks in data processing speed, impacting the efficiency of data analysis and decision-making processes.
Moreover, while these tools offer extensive functionalities, they can sometimes be overwhelming for beginners or non-technical users. The complexity involved in creating advanced visualizations or integrating diverse data sources can be a hurdle, pointing to a need for more intuitive and user-friendly solutions in the future.
Furthermore, even well-established tools like Power BI, while powerful, are not immune to these challenges. As datasets grow larger and the demand for real-time analytics increases, even Power BI users may face limitations in scalability and speed, underscoring the industry-wide need for more robust, efficient, and user-friendly data visualization solutions that can handle the data challenges of tomorrow.
- Identifying the limitations and challenges users face with these platforms.
Emerging Trends in Data Visualization
The data visualization field is witnessing a shift towards more predictive and prescriptive analytics, where tools not only depict what has happened but also forecast future trends and suggest actionable insights. This shift is accompanied by a greater emphasis on customization and personalization, catering to the specific needs and contexts of different users.
- Exploration of the latest trends shaping the future of data visualization, including predictive analytics, natural language processing, and more.
Another emerging trend is the incorporation of storytelling elements into data visualization, where data is not just presented but narrated in a way that is compelling and informative. This approach helps in making complex data more accessible and engaging, fostering a deeper understanding and connection with the audience.
Next-Generation Tools and Technologies
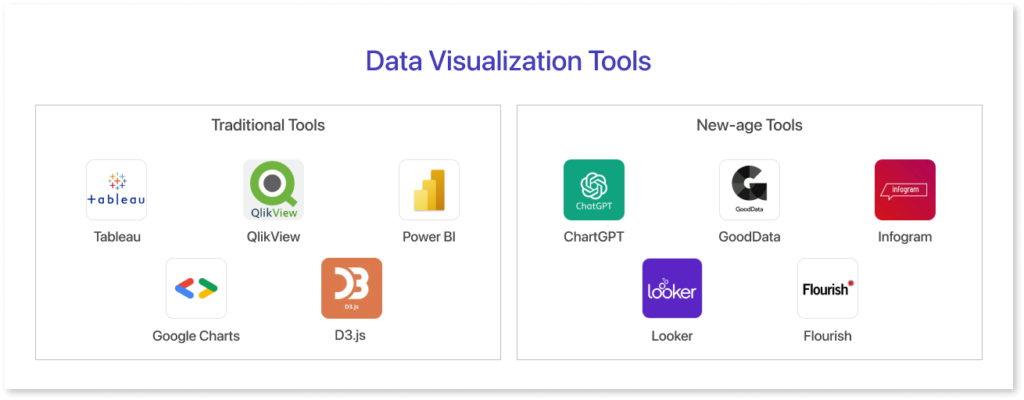
Augmented Analytics
Augmented analytics is revolutionizing data visualization by incorporating machine learning and AI to automate data preparation and analysis, allowing users to gain insights more quickly and accurately. This technology empowers users to focus on data interpretation and decision-making rather than getting bogged down in data processing.
Collaborative Visualization
The future of data visualization includes tools that enhance collaboration among teams, allowing multiple users to interact with and contribute to visualizations in real-time. This collaborative approach not only accelerates the decision-making process but also fosters a more inclusive environment where insights are shared and refined collectively.
- A look at upcoming tools and technologies poised to transform data visualization, emphasizing innovation and user experience.
Integration of AI and ML with Tableau and Power BI
The integration of AI and machine learning in data visualization tools is paving the way for smarter, self-service analytics where insights are not just presented but also interpreted by the system. This integration allows for more advanced predictive analytics and anomaly detection, offering users foresight and a deeper understanding of their data.
Incorporating AI and machine learning into tools like Power BI is transforming the landscape of data visualization, enabling these platforms to provide not only historical data representation but also forward-looking predictions and trends. Power BI, with its AI capabilities, is beginning to offer users more than just visual data exploration; it’s enabling them to uncover predictive insights, automate the detection of anomalies, and derive meaningful conclusions from their data sets.
This evolution signifies a shift towards more proactive and intelligent data handling, where tools are not just reactive but also predictive, helping businesses anticipate future trends and make informed decisions.
- Automated trend analysis and forecasting
- Enhanced pattern recognition and anomaly detection
- How AI and machine learning are being integrated into data visualization tools to provide predictive insights and automated analysis.
Real-Time Data Visualization
In today’s fast-paced world, the ability to visualize data in real time is becoming increasingly crucial. Next-generation tools are focused on minimizing latency and providing up-to-the-minute insights, enabling organizations to react promptly to changes and make informed decisions swiftly.
- Real-time monitoring and alerting
- Dynamic data streaming and processing
- The importance of real-time data visualization in today’s fast-paced environment and how new tools are addressing this need.
Interactive and Immersive Experiences
The evolution of data visualization is also heading towards more interactive and immersive experiences, where users can engage with data in a more intuitive and meaningful way. Technologies like VR and AR are being explored to create three-dimensional, immersive data visualizations that provide a novel perspective and understanding of data.
- Enhanced user engagement through interactive elements
- Immersive data exploration with VR and AR
- Advancements in creating more interactive and immersive data visualization experiences, including VR and AR applications.
The Role of Big Data in Visualization
The burgeoning growth of big data is reshaping the landscape of data visualization, necessitating tools that can adeptly manage and interpret extensive datasets. Power BI is at the forefront of this evolution, evolving to accommodate the increasing volume and complexity of big data. As such tools evolve, they must not only store and process large quantities of data but also empower users to rapidly navigate and extract valuable insights from this wealth of information, ensuring that the depth of big data is fully leveraged for informed decision-making.
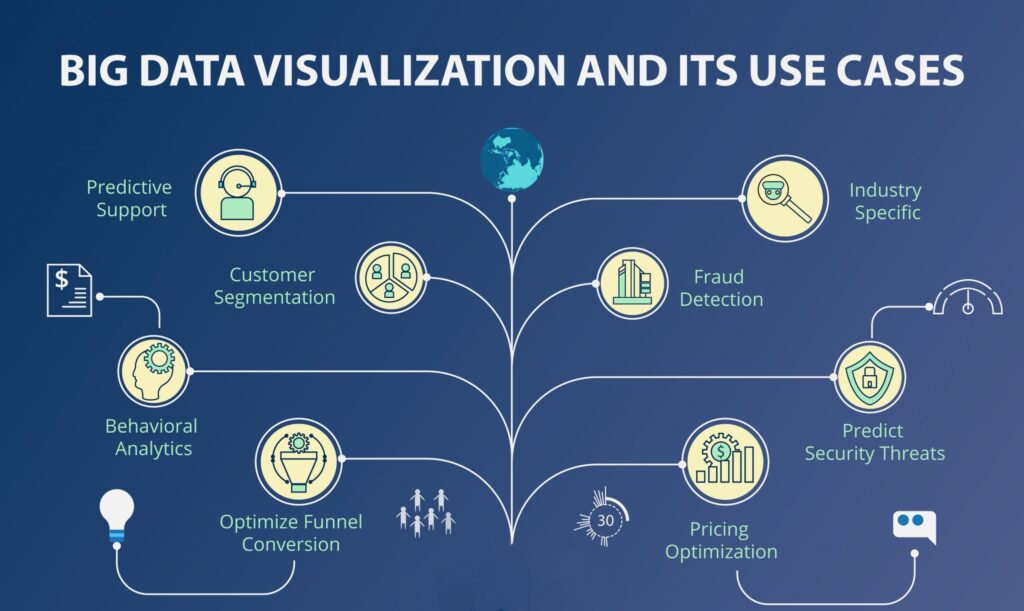
- Handling large-scale datasets with agility
- Integrating diverse data sources for comprehensive visualizations
- Examining how the explosion of big data is influencing the evolution of data visualization tools and techniques.
Future Predictions for Data Visualization Tools
The trajectory of data visualization tools is heading towards more adaptive, intelligent, and user-centric designs. We can anticipate a surge in tools that not only visualize data but also interpret it, offering predictive insights and actionable recommendations. The fusion of data visualization with AI will enable tools to learn from user interactions, tailor visualizations to individual preferences, and highlight relevant patterns without explicit user commands.
- Predictive and prescriptive analytics becoming mainstream in visualization tools
- Increased adoption of AI and machine learning for automated insight generation
- Integration of AR and VR for immersive data exploration experiences
- Enhanced collaboration features allowing real-time data interaction across teams
- Greater emphasis on user experience and customization
- Expert predictions on where data visualization tools are headed, focusing on customization, user engagement, and data interaction.
Moreover, the advent of augmented reality (AR) and virtual reality (VR) in data visualization will provide users with immersive experiences, allowing them to explore data in three-dimensional spaces and interact with it in more intuitive ways.
How Businesses Can Prepare for the Next Wave
As the landscape of data visualization evolves, businesses need to stay agile and informed to leverage the full potential of upcoming tools. Investing in workforce training is crucial to ensure that employees can adapt to and make the most of new data visualization technologies.
This includes not only understanding how to use new tools but also developing the analytical skills necessary to interpret and act on the insights generated. Additionally, businesses should focus on cultivating a data-driven culture that values evidence-based decision-making and encourages the exploration of data from multiple perspectives. By fostering a culture that embraces innovation and continuous learning, businesses can position themselves to capitalize on the advancements in data visualization tools.
- Encourage continuous learning and skill development in data analytics and visualization
- Foster a data-driven culture that encourages experimentation and data-centric decision-making
- Stay updated with technological advancements and incorporate cutting-edge tools into workflows
- Invest in infrastructure that supports the integration of advanced data visualization tools
- Engage in partnerships or collaborations to gain insights into best practices and emerging trends in data visualization
- Practical advice for businesses on staying ahead of the curve in adopting and leveraging the next generation of data visualization tools.
Conclusion
The evolution of data visualization tools is an ongoing journey, with each new development offering businesses and individuals unprecedented ways to understand and interact with data. As we move beyond Tableau and Power BI, the future looks promising, with more intuitive, interactive, and intelligent solutions on the horizon.
As we look toward the future of data visualization, it’s clear that the field is on the cusp of a new era marked by greater interactivity, collaboration, and intelligence. The next generation of tools will likely transform how we interpret and interact with data, making it more accessible, insightful, and actionable for a broader range of users. The evolution of these tools will continue to shape the landscape of data analytics, making it an exciting time for professionals in the field and organizations that rely on data-driven decision-making.
