In today’s data-centric world, where information reigns supreme, the art of data visualization is paramount. It’s the means by which we transform raw data into captivating visual narratives, unveiling hidden insights, and facilitating the communication of complex information. This comprehensive guide is your compass through the vast landscape of data visualization tools, ensuring you select the perfect instrument to illuminate your data’s potential.
Why Data Visualization Matters
Data visualization isn’t merely about aesthetics. It’s the bridge connecting raw data with human comprehension, simplifying the understanding of intricate datasets. In an era where data rules the decision-making process, the right data visualization tool can be the key to uncovering trends, patterns, and critical insights hidden within the numbers.
Types of Data Visualization Tools
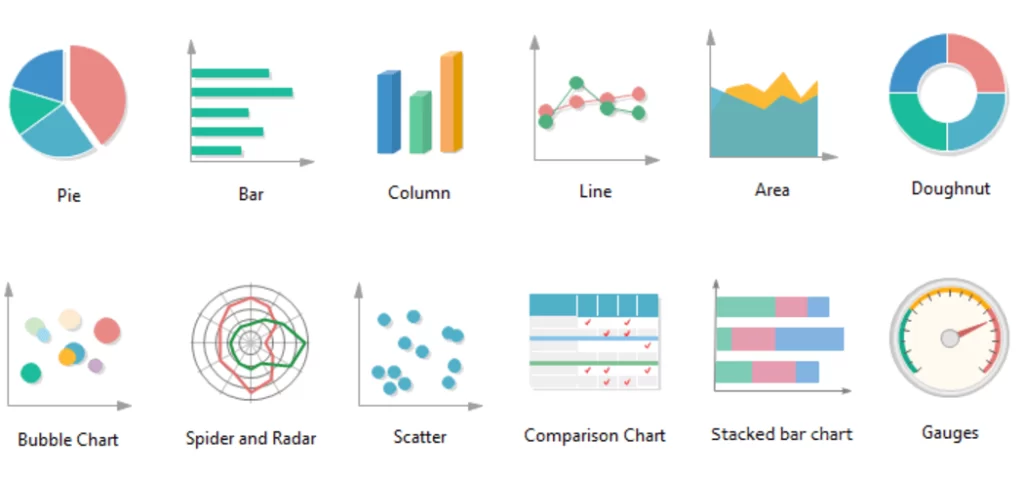
Data visualization tools come in a diverse array of shapes and sizes, each meticulously crafted to cater to specific needs and individual preferences. From traditional bar charts and line graphs to highly interactive, real-time dashboards, comprehending the multitude of options available is essential to make informed choices that align perfectly with your data visualization requirements.

- Static Graphs and Charts: These timeless tools, such as bar graphs, line charts, and pie charts, are excellent for representing data points and trends clearly.
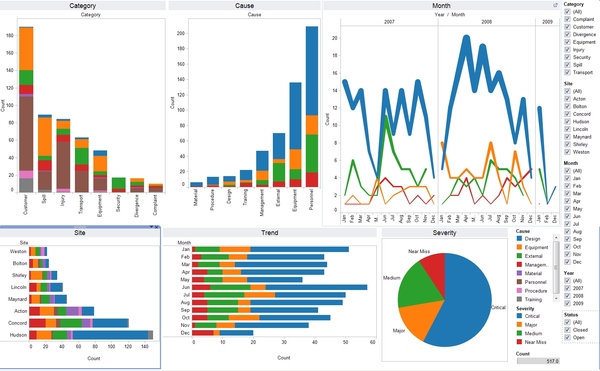
- Interactive Dashboards: Tools like Tableau and Power BI provide dynamic, real-time data representations. They’re perfect for exploring data, drilling down into details, and making decisions on the fly.
- Heat Maps: Ideal for displaying data points on a color scale, heat maps highlight patterns, concentration, and variations.
- Geospatial Visualization: Geospatial tools like ArcGIS are designed for data with geographical components, perfect for mapping and location-based data.
- Infographics: Visual storytelling at its best, infographics blend data, images, and text into an easy-to-understand narrative.
- Network Diagrams: When you need to illustrate relationships or connections in your data, network diagrams like those created with Gephi are your best choice.
Choosing the Right Tool
Selecting the ideal data visualization tool depends on your specific requirements, such as the nature of your data, your audience, and the story you want to tell. Consider these key factors:
- Data Complexity: Assess the complexity of your data. Simple datasets might shine with basic charts, while complex, multidimensional data could benefit from interactive dashboards.
- Audience: Think about who will be viewing your visualizations. Ensure your chosen tool suits their technical proficiency and needs.
- Interactivity: Depending on whether your audience requires real-time interaction with the data, pick tools that offer dynamic exploration.
- Integration: Consider how well the tool integrates with your existing data systems and whether it allows for smooth data importing and exporting.
- Cost: Some tools are open source, while others require a subscription. Ensure the tool aligns with your budget.

Democratizing Data
In today’s data-centric world, the democratization of data is well underway, and data visualization tools are the key drivers behind this movement. These tools empower individuals and organizations to delve into their data, conduct in-depth analyses, and gain profound insights. It’s not just about making data visually appealing; it’s about making data insights accessible, understandable, and actionable.
Selecting the most suitable data visualization tool is a pivotal decision in your data journey. It’s not only about converting data into insights; it’s about crafting a compelling narrative that resonates with your audience. With the right tool at your disposal, you can transform raw data into an engaging story, steering decisions, and advancing progress in this data-driven era. Remember that the world of data visualization is ever-evolving, with new tools and techniques emerging. Stay curious, keep learning, and explore the vast possibilities of data visualization. Your ability to harness these tools effectively will be the linchpin of your data success.


