Table of Contents
In today’s digital age, data is ubiquitous, and its significance cannot be overstated. Whether you’re a business professional, a student, or simply someone curious about the world of data, understanding the basics of analytics is a valuable skill.
What is Data Analytics 101?
At its core, it’s the process of examining, cleaning, transforming, and interpreting data with the goal of discovering meaningful insights, making informed decisions, and supporting various objectives. This field is like a powerful magnifying glass, allowing you to scrutinize data to uncover hidden patterns, trends, and information.
The History and Evolution of Data Analytics
Data analytics may feel like a modern concept, but its roots trace back centuries. The journey of analytics has evolved alongside the development of mathematics, computing, and digital technologies.
Early Beginnings
The origins date back to the 18th and 19th centuries, when statisticians first began using mathematical methods to analyze population and economic data. This laid the foundation for modern statistical analysis.
The Rise of Computers
The 1960s and 1970s marked a major turning point with the invention of computers. Organizations began using software to store, retrieve, and analyze large volumes of data—something previously impossible with manual techniques.
The Big Data Explosion
By the 2000s, the rise of the internet, mobile devices, and social media created unprecedented amounts of data. This era gave birth to:
- Big Data technologies
- Cloud computing
- Real-time data processing
Modern Era of Analytics
Today, data analytics is powered by advanced technologies such as:
- Machine learning
- Artificial intelligence
- Predictive modeling
- Automation
- Real-time streaming analytics
This evolution has transformed analytics from simple reporting into a powerful tool for strategic decision-making across industries.
Why Data Analytics Is Important
Data analytics is more than just a trend—it’s a fundamental driver of modern success. It plays a crucial role in helping individuals and organizations:
1. Reduce Uncertainty
Data-driven decisions significantly reduce guesswork and highlight what actions are most likely to succeed.
2. Enhance Operational Efficiency
Analytics identifies inefficiencies, bottlenecks, and opportunities for process improvement.
3. Understand Customer Behavior
It helps businesses track preferences, purchasing patterns, and user interactions to improve personalization.
4. Drive Innovation
Organizations use analytics to test new ideas, optimize strategies, and validate product improvements.
5. Improve Risk Management
Analytics helps detect anomalies, forecast threats, and prevent potential failures, especially in finance, cybersecurity, and compliance.
6. Gain Competitive Advantage
Companies that leverage analytics outperform those that rely on intuition alone by responding quickly to market changes.
Why Data Analytics Matters
Data analytics 101 offers a multitude of benefits, making it a critical tool in various domains:
- Informed Decision-Making: In a data-driven world, decisions based on facts and evidence are more likely to succeed. Data analytics empowers individuals and organizations to make choices grounded in data.
- Problem Solving: Data analytics is a problem-solving tool. It helps identify issues, explore potential solutions, and assess their effectiveness through data-driven experimentation.
- Optimizing Operations: For businesses, data analytics can enhance efficiency and productivity by identifying bottlenecks, resource wastage, and opportunities for improvement.
- Understanding Trends: By analyzing data, you can gain insights into trends, customer behaviors, and market dynamics, helping you stay ahead of the curve.
The Data Analytics 101 Process Guide
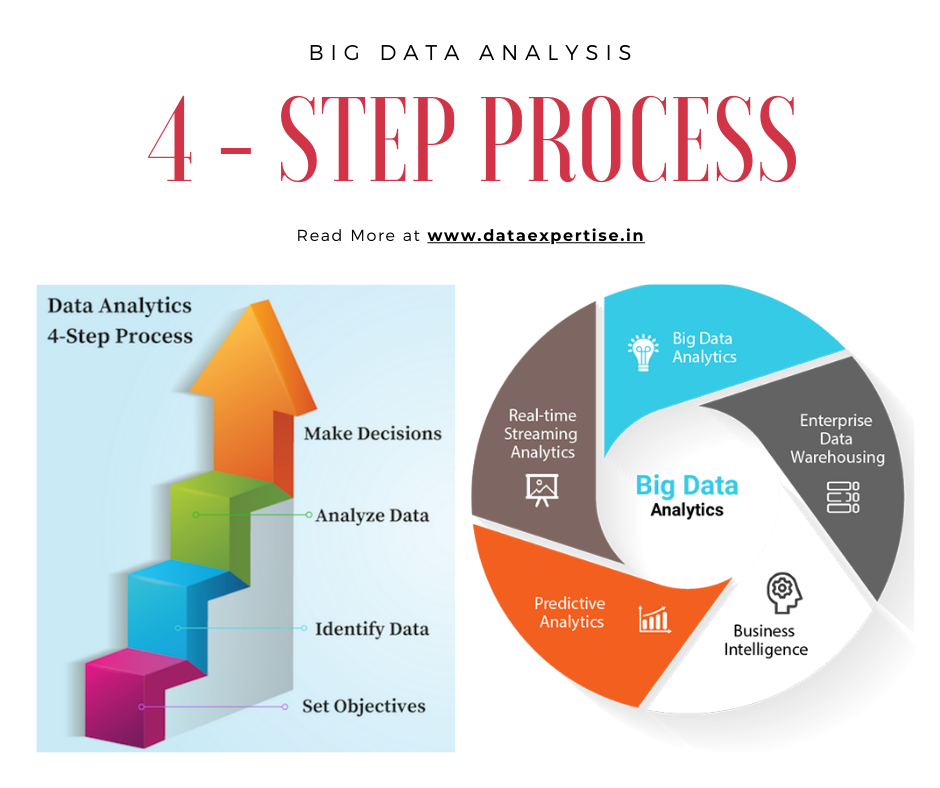
Data analytics 101 guide is not a single-step operation; it involves a series of stages:

- Data Collection: The process begins with gathering data from various sources. This can include structured data from databases, spreadsheets, or unstructured data like text or images.
- Data Cleaning: Raw data is rarely pristine. It often contains errors, missing values, or inconsistencies. Data cleaning is the process of identifying and rectifying these issues to ensure data quality.
- Data Analysis: Here, data analysts explore data to identify patterns, trends, and relationships. This step involves various statistical and data mining techniques.
- Data Visualization: To communicate their findings effectively, analysts use data visualization tools like charts, graphs, and dashboards to present insights in a visual and understandable manner.
Types of Data Analytics
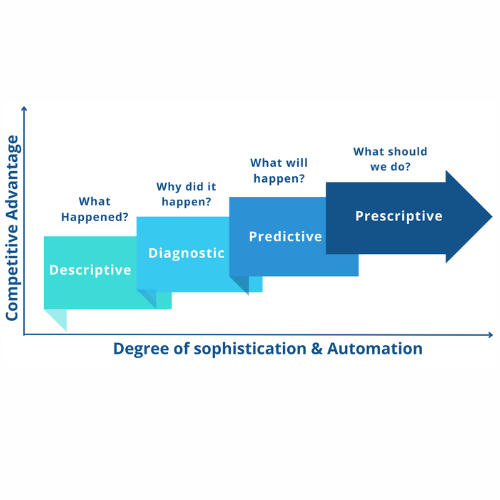
Data analytics encompasses several types, each with its own focus:
- Descriptive Analytics: This type focuses on summarizing historical data to provide a snapshot of past events. It helps answer questions like “What happened?”
- Diagnostic Analytics: Diagnostic analytics delves deeper into data to understand why certain events occurred. It helps identify the causes of past outcomes.
- Predictive Analytics: Predictive analytics uses historical data to build models that forecast future events or trends. It can help answer questions like “What is likely to happen next?”
- Prescriptive Analytics: The most advanced form of analytics, prescriptive analytics not only predicts future events but also provides recommendations on what actions to take to achieve desired outcomes.
- Text Analytics (Text Mining): Text analytics involves extracting valuable insights from unstructured text data, such as customer reviews, social media posts, or news articles.
- Web Analytics: Web analytics deals with the measurement and analysis of web data, including website traffic, user behavior, and online marketing performance. It helps businesses optimize their online presence and marketing strategies.
- Fraud Analytics: Fraud analytics uses data to detect and prevent fraudulent activities. It’s employed in finance, insurance, and e-commerce to identify and mitigate fraud risks.

Each of these analytics types serves specific purposes in different industries and domains, contributing to better decision-making, problem-solving, and overall business or organizational success.
Key Tools and Technologies in Data Analytics
To perform effective analytics, you need the right mix of tools and technologies. These can be categorized into several groups:
1. Data Collection Tools
- Google Analytics
- Web scraping tools
- APIs
- CRM systems
2. Data Storage & Management
- SQL Databases (MySQL, PostgreSQL, SQL Server)
- NoSQL Databases (MongoDB, Cassandra)
- Cloud platforms (AWS, Azure, Google Cloud)
3. Data Processing & Cleaning Tools
- Excel & Google Sheets
- Python (Pandas, NumPy)
- R (dplyr, tidyr)
- ETL tools
4. Data Analysis Tools
- Python (scikit-learn, SciPy)
- R (ggplot2, caret)
- SAS
- SPSS
5. Data Visualization Tools
- Tableau
- Power BI
- Google Data Studio
- Matplotlib & Seaborn (Python)
- Excel charts
6. Big Data Technologies
- Hadoop
- Spark
- Kafka
- Databricks
7. Machine Learning Platforms
- TensorFlow
- PyTorch
- AWS Sagemaker
- Google Vertex AI
These tools empower analysts to collect, clean, process, analyze, and visualize data at scale.
Exploratory Data Analysis (EDA)
Exploratory Data Analysis (EDA) is an essential stage in the analytics lifecycle. It helps analysts understand the structure and patterns in the dataset before applying models or drawing conclusions.
Key Objectives of EDA
- Identify missing values and anomalies
- Understand distribution patterns
- Detect relationships and correlations
- Validate assumptions for further analysis
Common EDA Techniques
- Descriptive statistics
- Histograms and box plots
- Scatter plots
- Correlation heatmaps
- Outlier detection
- Feature profiling
EDA is considered the foundation of strong analytics, as it ensures accurate insights and prevents errors in later stages.
Getting Started with Data Analytics
If you’re interested in diving into analytics, here are some steps to consider:
- Learn the Basics: Familiarize yourself with fundamental concepts, terminology, and statistical methods.
- Tools and Software: Explore data analytics tools like Microsoft Excel, Google Sheets, or open-source software like Python and R.
- Online Courses: Numerous online platforms offer courses and tutorials on data analytics, catering to various skill levels.
- Practice: The best way to learn data analytics is by doing. Work on small projects, analyze datasets and apply what you’ve learned.
- Stay Curious: The world of data analytics is constantly evolving. Keep up with industry trends and new technologies to enhance your skills.
Applications of Data Analytics
Data analytics has widespread applications across industries, transforming how organizations operate and make decisions.
1. Business and Marketing
- Customer segmentation
- Campaign performance analysis
- Lead scoring
- Market trend prediction
2. Finance
- Fraud detection
- Credit scoring
- Portfolio optimization
- Risk assessment
3. Healthcare
- Patient diagnosis and predictive treatment
- Hospital resource management
- Disease outbreak prediction
4. eCommerce
- Dynamic pricing
- Product recommendation engines
- Supply chain optimization
5. Manufacturing
- Predictive maintenance
- Quality control monitoring
- Inventory forecasting
6. Education
- Student performance analytics
- Course effectiveness insights
Data analytics truly touches every sector where data exists—which today means almost everywhere.
Career Path and Further Learning
Data analytics offers diverse career opportunities for beginners, intermediate learners, and advanced professionals.
Entry-Level Roles
- Data Analyst
- Business Analyst
- Reporting Analyst
- Junior Data Scientist
Mid-Level Roles
- Data Engineer
- Machine Learning Engineer
- Data Consultant
- BI Developer
Advanced Roles
- Senior Data Scientist
- AI Specialist
- Analytics Manager
- Chief Data Officer (CDO)
Skills Needed
- Statistics
- SQL
- Python or R
- Data visualization
- Communication and storytelling
- Problem-solving
Learning Resources
- Online courses (Coursera, Udemy, edX)
- Professional certifications (Google Data Analytics, AWS, Microsoft)
- Real-world projects (Kaggle datasets)
- Community groups and hackathons
The Future of Data Analytics
The future of data analytics is shaped by rapid technological advancements and an increasing reliance on data-driven solutions.
1. AI-Powered Analytics
AI will automate data preparation, analysis, and prediction, making insights faster and more accurate.
2. Real-Time Decision Systems
Businesses will rely heavily on streaming analytics for instant insights—especially in finance, retail, and IoT.
3. Augmented Analytics
AI assistants will help analysts explore data, detect patterns, and create visualizations automatically.
4. Edge Analytics
Data processing will move closer to the source (sensors, IoT devices) for faster and more secure operations.
5. Greater Emphasis on Data Privacy
Analytics will include stronger controls around ethical data usage and privacy protection.
6. Democratization of Analytics
More non-technical users will gain access to powerful tools, making analytics a skill for everyone—not just data professionals.
Conclusion
data analytics is an exciting field that empowers individuals and organizations to make data-driven decisions. This introductory overview provides a glimpse into the world of analytics, but there’s much more to explore and learn as you embark on your journey into this dynamic and rewarding field.
FAQ’s
What is data analyst 101?
Data Analyst 101 is a beginner’s guide to understanding data analytics, covering the basics of collecting, analyzing, and interpreting data to make informed business decisions.
What are the 5 C’s of data analytics?
The 5 C’s of data analytics are Collection, Cleaning, Consistency, Context, and Communication, which guide analysts in gathering accurate data, ensuring quality, understanding it in the right context, and effectively sharing insights.
What are the 4 pillars of data analytics?
The four pillars of data analytics are Data, Technology, Process, and People, which together enable organizations to collect, analyze, and use data effectively for informed decision-making.
What are the three levels of data analytics?
The three levels of data analytics are descriptive (what happened), predictive (what could happen), and prescriptive (what should be done), helping organizations understand past trends, forecast future outcomes, and make informed decisions.
What are the basic concepts of data analytics?
The basic concepts of data analytics include data collection, data cleaning, data analysis, data visualization, and interpretation of insights to support informed decision-making.


