Introduction to Data Visualization Examples
Data visualization examples are crucial in helping us understand complex data by presenting it in a visual format. By converting data into visual representations, we can quickly grasp patterns, trends, and insights that might be difficult to comprehend from raw data alone. In today’s data-driven world, mastering data visualization techniques is essential for professionals across various industries.
Moreover, effective data visualizations can enhance storytelling by transforming data into compelling narratives. This ability to communicate data insights clearly and concisely is invaluable for decision-making, allowing businesses to respond swiftly to emerging trends and make informed strategic choices.
The Importance of Data Visualization
Data visualization is essential because it allows us to see large amounts of data clearly and concisely. Effective data visualizations can help businesses make informed decisions, communicate findings to stakeholders, and identify areas for improvement. Moreover, data visualization examples help to highlight the significance of data in storytelling and decision-making processes.
Key benefits of data visualization include:
- Simplifying complex data
- Identifying trends and patterns
- Enhancing data comprehension
- Facilitating decision-making
- Improving communication of insights
Common Data Visualization Techniques

1. Bar Charts
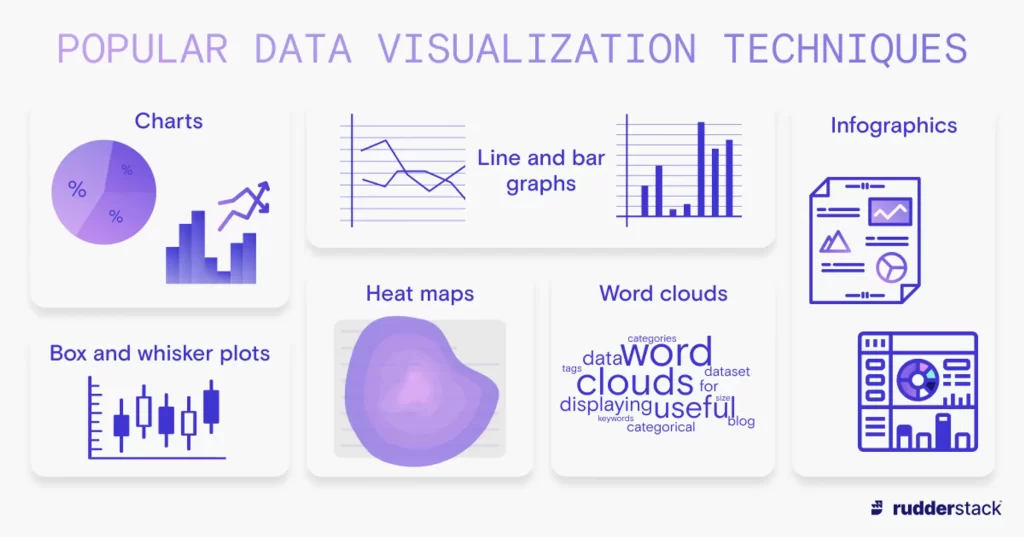
Bar charts are one of the most common data visualization techniques for comparing different categories or groups. They are simple yet effective in showing differences in magnitude.
2. Line Graphs
Line graphs are ideal for visualizing data trends over time. They are commonly used in time series analysis to show how data points change over a continuous interval.
3. Scatter Plots
Scatter plots are used to display the relationship between two variables. We can see correlations and patterns by plotting data points on a two-dimensional graph.
4. Pie Charts
Pie charts are used to show the proportions and percentages of a whole. Each slice of the pie represents a category, making it easy to compare parts of the data.
Advanced Data Visualization Techniques
1. Heatmaps
Heatmaps use color gradients to represent data values. They are useful for showing the intensity of data points over an area, such as population density or website traffic.
2. Treemaps
Treemaps display hierarchical data using nested rectangles. Each rectangle represents a category, and its size corresponds to a specific data value, making it easy to compare different categories.
3. Sankey Diagrams
Sankey diagrams visualize the flow of data between different stages or processes. They are often used in energy, finance, and supply chain management to show resource allocation.
4. Network Diagrams
Network diagrams represent relationships between entities, such as social networks or communication systems. They help to visualize connections and interactions within a dataset.
Real-World Data Visualization Examples
Data visualization is a theoretical concept and a powerful tool across various industries to translate complex data into actionable insights. By leveraging effective visualization techniques, organizations can monitor performance, optimize strategies, and make informed decisions based on real-time data. Whether it’s through interactive dashboards, social media analytics, financial market analysis, or health data visualizations, the ability to visually interpret data is critical for driving success and innovation in today’s data-centric world. Here are some real-world examples of how data visualization is applied across different sectors:
Business Intelligence Dashboards
Business intelligence dashboards aggregate data from various sources and present it in an interactive format. These dashboards help organizations monitor key performance indicators (KPIs) and make data-driven decisions.
Social Media Analytics
Social media platforms generate vast amounts of data. Visualization techniques such as sentiment analysis and engagement metrics help businesses understand user behavior and optimize their social media strategies.
Financial Market Analysis
Financial analysts use data visualization to track market trends, stock performance, and economic indicators. Tools like candlestick charts and histograms are commonly used in financial market analysis.
Health Data Visualization
Healthcare professionals use data visualization to track patient outcomes, disease outbreaks, and treatment effectiveness. Visualizations like heat maps and survival curves are essential in health data analysis.
Tools for Creating Data Visualizations
Tableau
Tableau is a powerful data visualization tool that allows users to create interactive and shareable dashboards. It is widely used in business intelligence for its user-friendly interface and extensive visualization capabilities.
Power BI
Power BI is a business analytics service by Microsoft that provides interactive visualizations and business intelligence capabilities. It is known for its seamless integration with other Microsoft products and its robust data modeling features.
D3.js
D3.js is a JavaScript library for creating dynamic and interactive data visualizations in web browsers. It is highly flexible and allows developers to create custom visualizations tailored to their specific needs.
Google Data Studio
Google Data Studio is a free tool that allows users to create customizable and interactive data visualizations. It integrates with various Google services, making it easy to visualize data from different sources.
Data Visualization Best Practices
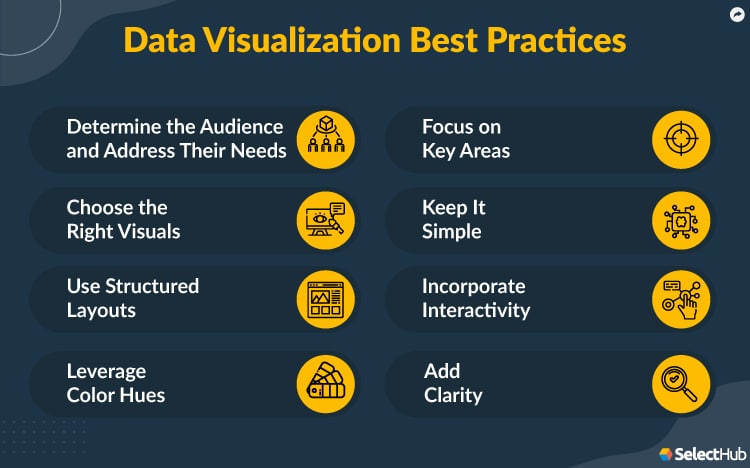
Creating effective data visualizations requires adherence to best practices that ensure clarity, accuracy, and usability. By keeping visualizations simple and focused, selecting the appropriate chart types, using color strategically, and providing necessary context through labels and legends, you can enhance the comprehension and impact of your data.
Additionally, regularly testing your visualizations for clarity and interpretability helps ensure that they effectively communicate the intended insights to your audience. These best practices are essential for transforming raw data into meaningful visual stories that drive informed decision-making.

To create effective data visualizations, it is important to follow best practices:
- Keep it simple: Avoid clutter and focus on the most important data points.
- Choose the right chart type: Select a visualization technique that best represents your data.
- Use color wisely: Use colors to highlight key information and ensure readability.
- Provide context: Include labels, legends, and titles to help users understand the data.
- Test your visualizations: Ensure that your visualizations are clear and easy to interpret.
Challenges and Solutions in Data Visualization
Data visualization comes with its own set of challenges, such as data quality issues, selecting the appropriate visualization technique, and ensuring that visualizations are accessible to all users. To overcome these challenges:
- Clean and preprocess data to improve quality.
- Choose the right visualization technique based on the data and audience.
- Use tools and practices that ensure accessibility, such as color contrast and alternative text.
The Future of Data Visualization
The future of data visualization looks promising with advancements in technology and an increasing emphasis on data-driven decision-making. Emerging trends include:
- Integration of AI and machine learning to automate data visualization.
- Enhanced interactivity and user experience through immersive technologies like virtual reality (VR) and augmented reality (AR).
- Greater focus on real-time data visualization to support faster decision-making.
- Development of more sophisticated and customizable visualization tools.
FAQs
What is data visualization?
Data visualization is the graphical representation of data to help people understand complex data sets by presenting them in a visual format.
Why is data visualization important?
Data visualization is important because it simplifies complex data, making it easier to identify trends, patterns, and insights that can inform decision-making.
What are some common data visualization techniques?
Common data visualization techniques include bar charts, line graphs, scatter plots, and pie charts.
What tools are used for data visualization?
Popular tools for data visualization include Tableau, Power BI, D3.js, and Google Data Studio.
What are the challenges in data visualization?
Challenges in data visualization include data quality issues, selecting the appropriate visualization technique, and ensuring accessibility.


Hello. splendid job. I did not expect this. This is a great story. Thanks!