Introduction
Delving into the world of geographical data, this blog explores the dynamic field of Data Visualization for Geographic Data, focusing on maps and geospatial analysis. We will navigate through the various techniques and tools used in visualizing geographic information, highlighting their significance in making data-driven decisions and understanding spatial relationships.
Our focus keyword, ‘Data Visualization for Geographic Data’, is a pivotal aspect of this discussion, offering insights into how maps and geospatial analysis transform complex geographical datasets into comprehensible visual formats. As we journey through this topic, we will incorporate real-time examples to illustrate the practical applications of these visualization techniques.
The Importance of Geographic Data Visualization

Geographical Data Visualization is crucial in interpreting and understanding spatial data. It transforms raw geographical data into visual formats like maps, charts, and graphs, making it easier to identify patterns, trends, and relationships. This form of visualization is vital in various fields such as urban planning, environmental science, and transportation logistics.
- Key Benefits: Enhances understanding of spatial patterns, aids in decision-making, and improves communication of geographic information.
- Applications: Used in disaster management, urban development, and resource allocation.
Real-time example: Urban planners use geographical data visualization to analyze population density and plan city infrastructures accordingly.
Mapping Techniques in Geographic Data Visualization

Mapping techniques are at the heart of geographic data visualization. They involve various methods of representing geographical data on maps, each suited for different types of data and analysis purposes.
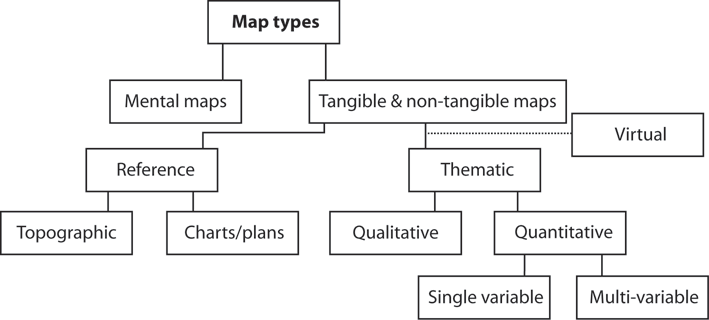
- Types of Maps: Thematic maps, topographic maps, choropleth maps, and heat maps.
- Choosing the Right Map: Depends on the nature of the data and the intended message or analysis.
Real-time example: Environmental scientists use heat maps to visualize areas affected by climate change, such as rising temperatures or declining rainfall patterns.
Geospatial Analysis Techniques
Geospatial Analysis is a critical component of geographic data visualization, involving the use of various techniques to analyze spatial data and extract meaningful information. This analysis helps in understanding the geographical context, patterns, and trends that are not immediately apparent in raw data.
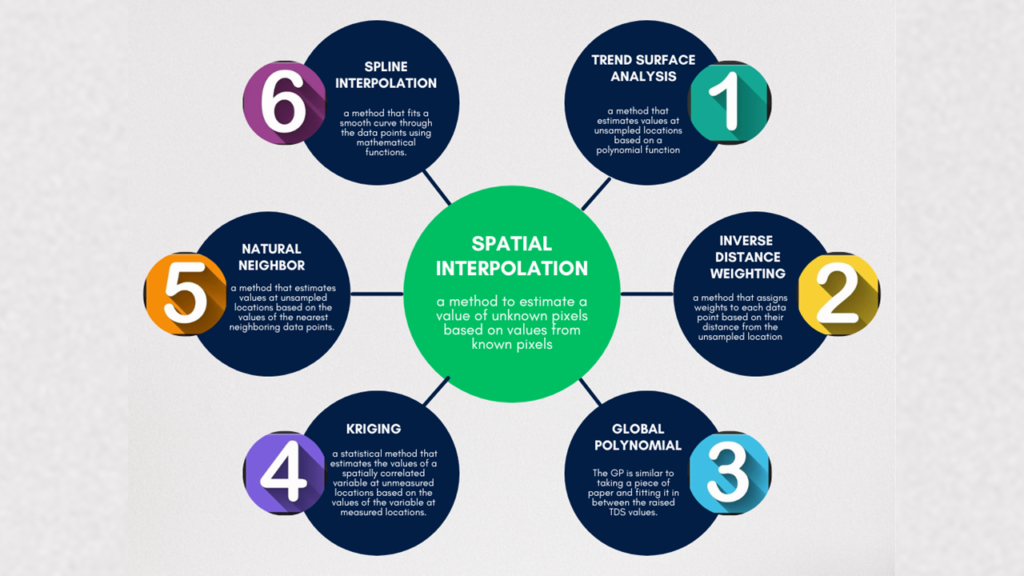
- Key Techniques: Spatial querying, buffer analysis, network analysis, and spatial interpolation.
- Applications: Used in route planning, market analysis, and environmental impact studies.

Real-time example: Logistics companies use network analysis for optimizing delivery routes, considering factors like distance, traffic, and delivery times.
Tools and Software for Geographic Data Visualization
The effectiveness of geographic data visualization largely depends on the tools and software used. There is a wide range of software available, each with unique features and capabilities suited for different visualization needs.
- Popular Tools: GIS software like ArcGIS, QGIS; Data visualization tools like Tableau and Power BI.
- Choosing the Right Tool: Depends on the complexity of the data, required features, and user proficiency.
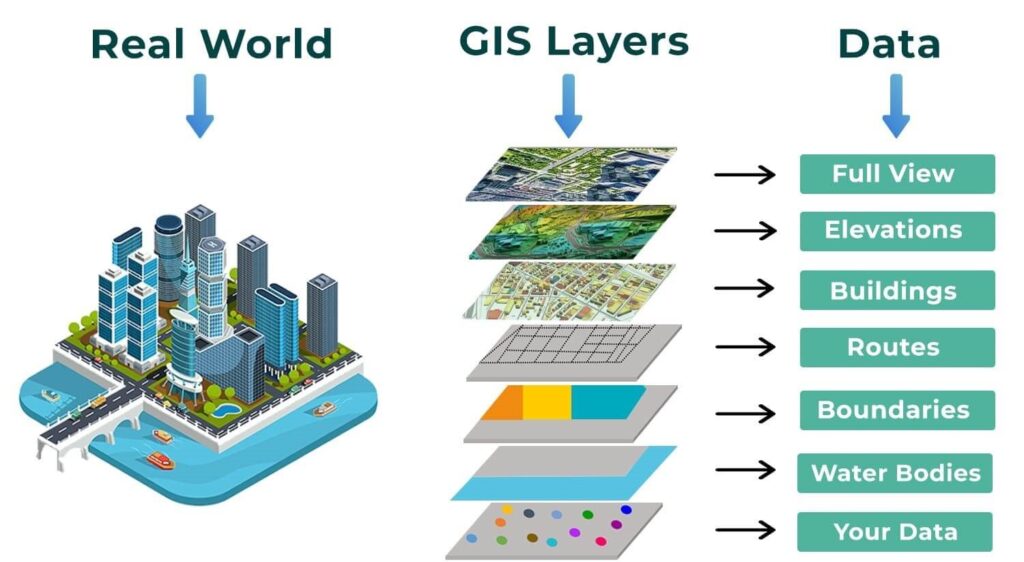
Real-time example: City planners use GIS software to integrate various data layers like zoning, land use, and traffic data for comprehensive urban planning.
Challenges and Future Trends in Geographic Data Visualization
While geographic data visualization offers immense benefits, it also comes with its set of challenges, such as data accuracy, privacy concerns, and the complexity of integrating diverse data sources. However, the future looks promising with advancements in technology such as AI, machine learning, and increased accessibility of geospatial data.
Real-time example: Smart city initiatives are increasingly leveraging geographic data visualization combined with IoT and AI to enhance urban living experiences, from traffic management to environmental monitoring.
Conclusion
In conclusion, Data Visualization for Geographical Data, encompassing maps and geospatial analysis, is a powerful tool in understanding and communicating complex spatial information. The right combination of techniques, tools, and analysis can transform raw data into actionable insights, driving informed decisions in various sectors. As technology evolves, so will the capabilities and applications of geographic data visualization, making it an exciting field to watch and engage with.
This comprehensive guide has provided an in-depth look into the world of geographic data visualization, offering valuable insights and real-time examples to help you navigate this dynamic field.


