Introduction to Data Storytelling
In today’s data-driven world, the ability to convey complex information effectively is invaluable. Data storytelling emerges as a pivotal skill, blending analytics with narrative to transform raw data into compelling narratives. This introductory section sets the stage for understanding the essence and significance of data storytelling in various domains.
- Key Points:
- Definition.
- Its importance in modern business, science, and technology.
The Art and Science of Data Storytelling

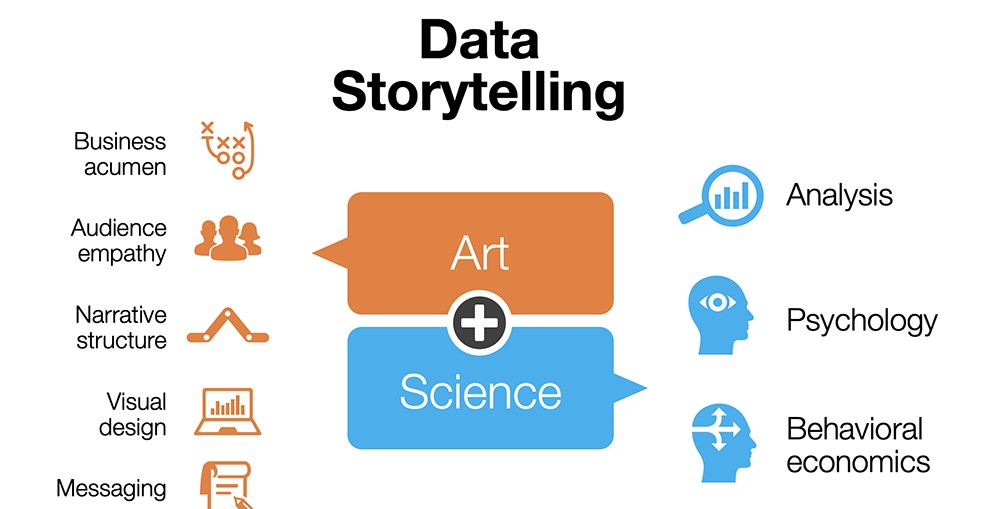
Data storytelling is a unique amalgamation of art and science. It requires a balance between analytical rigor and creative narrative construction. This section delves into how data storytelling transcends traditional data analysis, making information not just accessible but also engaging and persuasive.
- Key Points:
- The blend of technical and creative skills in storytelling.
- Role of narrative and visualization in enhancing data comprehension.
Key Elements of Effective Data Narratives

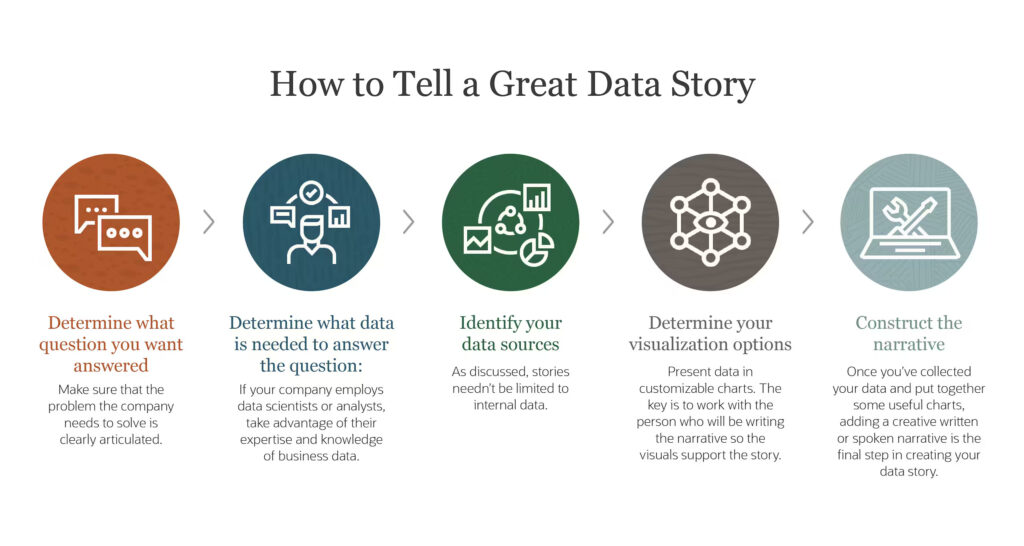
Crafting an effective data story involves several key elements. This part of the blog will explore these elements, emphasizing their role in making data stories clear, engaging, and insightful.
- Key Points:
- Identifying and understanding the target audience.
- Constructing a clear, concise, and engaging storyline.
- Utilizing visual elements to complement and enhance the narrative.
Tools and Techniques
In the realm of data storytelling, the selection of appropriate tools and techniques can significantly elevate the narrative’s impact. Advanced tools like Tableau offer a vast array of visualization options, from basic bar charts to intricate geographical maps, enabling storytellers to tailor their visualizations to the story’s needs.
Power BI, on the other hand, excels in integrating data from various Microsoft sources, providing a seamless experience for those already embedded in the Microsoft ecosystem.
Beyond these, open-source tools like Python’s Matplotlib or JavaScript’s D3.js offer unparalleled customization for those with coding skills, allowing for the creation of unique and interactive data visualizations. The technique is equally important; it involves not just the visual representation of data but also the narrative structure. This includes setting the context, building a storyline around the data, and guiding the audience to the intended conclusion.
Effective data storytelling thus becomes a harmonious blend of the right tools and narrative techniques, each complementing the other to bring data to life in the most compelling way possible.
- Key Points:
- Overview of data visualization tools and their features.
- Techniques for effective data visualization and narrative development.
Real-World Examples in Action
Practical examples bring to life the concepts of data storytelling. This section will showcase how different industries utilize data storytelling, supported by case studies and expert insights.
Case Study: A financial services firm uses data storytelling to illustrate consumer spending habits during the holiday season. They utilize Power BI to create a dynamic report that combines sales data with consumer surveys, providing valuable insights for retailers.
- Key Points:
- Case studies from industries like marketing, finance, and healthcare.
- Insights and quotes from experts on successful storytelling projects.
Challenges and How to Overcome Them

Challenges
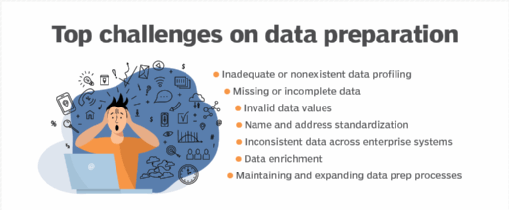
While transformative, storytelling with data is not without its challenges. One of the primary hurdles is the complexity of the data itself. Data sets can be vast and intricate, making it difficult to distill them into a coherent and engaging narrative.
This complexity is often compounded by the varying levels of data literacy in an audience, making it challenging to create a story that is both accurate and easily understandable. Additionally, the risk of bias or misinterpretation looms large; storytellers must be vigilant to present data objectively, avoiding the temptation to skew information to fit a preconceived narrative.
How to Overcome Them
Overcoming these challenges requires a blend of skill, strategy, and technology. To tackle the complexity of data, storytellers can employ data segmentation and focus on key data points that drive the narrative, ensuring clarity and conciseness. Enhancing audience engagement and understanding can be achieved through interactive visualizations that allow viewers to explore data at their own pace.
Addressing bias and misinterpretation involves rigorous data validation and a commitment to ethical storytelling practices. Moreover, leveraging advanced data visualization tools and AI can aid in uncovering unbiased insights and presenting them in an impactful way. Ultimately, the goal is to transform data from mere numbers into a narrative that resonates with and enlightens the audience.
- Points:
- Common obstacles in data storytelling.
- Strategies and best practices to address these challenges.
The Future of Data Storytelling
The future of data storytelling is an exciting prospect. This section will explore emerging trends and predict how advancements in technology might influence the evolution of data storytelling.
- Key Points:
- Emerging trends.
- Predictions on the future impact of AI and machine learning.
Conclusion
The concluding section will wrap up the discussion, highlighting the indispensable role of storytelling in interpreting and communicating data effectively in the modern world. It’s clear that data storytelling is more than just a trend; it’s an essential skill in today’s information-rich world. It bridges the gap between complex data analysis and meaningful insights, enabling professionals across various fields to make informed decisions and drive impactful actions.
As we continue to generate and interact with vast amounts of data, the art and science of data storytelling will remain a key tool in translating data into knowledge and wisdom, fostering a more data-literate society where decisions are driven by informed narratives. This evolution in data communication marks a significant step towards a future where data is not just seen, but understood and acted upon effectively.


