Introduction to Mastering Data Analysis
Mastering data analysis is crucial for professionals in today’s data-driven world. Understanding and applying the right techniques and tools can transform raw data into meaningful insights, driving informed decision-making and strategic planning. As data continues to grow exponentially, the need for skilled data analysts who can navigate complex datasets and extract valuable insights becomes increasingly important.
In addition to technical expertise, mastering data analysis also involves developing a critical mindset and the ability to ask the right questions. Effective data analysts not only interpret data but also communicate their findings in a clear and actionable manner. This skill set is invaluable across various industries, from healthcare and finance to marketing and logistics, making data analysis a highly versatile and rewarding career path.
Importance of Data Analysis in Today’s World
Data analysis plays a pivotal role in various industries, enabling organizations to understand trends, measure performance, and make data-driven decisions. From improving customer experiences to optimizing operations, effective data analysis can significantly impact a company’s success.
Data analysis helps businesses:
- Identify patterns and trends
- Enhance decision-making processes
- Improve operational efficiency
- Increase profitability
- Drive innovation and growth
Moreover, the ability to harness and interpret data effectively allows companies to stay competitive in a rapidly changing market. By leveraging data insights, organizations can anticipate market shifts, respond to consumer needs more efficiently, and ultimately achieve a more sustainable growth trajectory.
Key Data Analysis Techniques

Descriptive Analysis
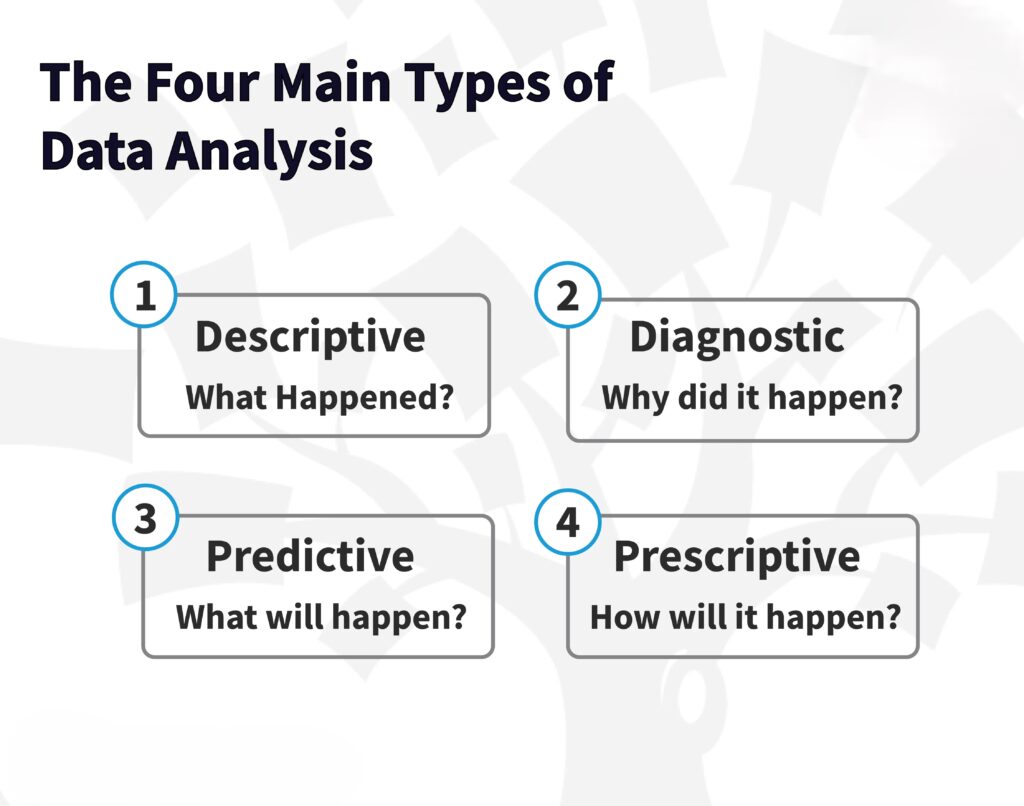
Descriptive analysis involves summarizing historical data to understand what has happened in the past. This technique is essential for identifying trends and patterns within the data.
Inferential Analysis
Inferential analysis uses statistical methods to make inferences about a population based on a sample of data. It helps in understanding relationships and making predictions.
Predictive Analysis
Predictive analysis leverages statistical algorithms and machine learning techniques to forecast future outcomes based on historical data. This technique is widely used in finance, marketing, and healthcare.
Prescriptive Analysis
Prescriptive analysis goes beyond predicting future outcomes by recommending actions that can be taken to achieve desired results. It uses optimization and simulation techniques to provide actionable insights.
Essential Data Analysis Tools
Python
Python is a versatile programming language widely used in data analysis due to its simplicity and extensive libraries like Pandas, NumPy, and SciPy.
R
R is a statistical programming language that excels in data analysis and visualization. It offers a wide range of packages for statistical analysis and graphing.
SQL
SQL (Structured Query Language) is essential for managing and querying relational databases. It allows data analysts to extract and manipulate data efficiently.
Tableau
Tableau is a powerful data visualization tool that enables users to create interactive and shareable dashboards. It helps in presenting data insights in an easily understandable format.
Power BI
Power BI is a business analytics tool by Microsoft that provides interactive visualizations and business intelligence capabilities. It allows users to create reports and dashboards that help in data-driven decision-making.
Real-world applications of Data Analysis
Data analysis is applied in various sectors to solve real-world problems and drive growth. Here are some examples:
- Healthcare: Analyzing patient data to improve treatment plans and outcomes.
- Finance: Predicting stock market trends and managing risk.
- Retail: Optimizing inventory and personalizing marketing strategies.
- Manufacturing: Enhancing supply chain efficiency and product quality.
- Education: Monitoring student performance and improving learning outcomes.
Best Practices for Effective Data Analysis

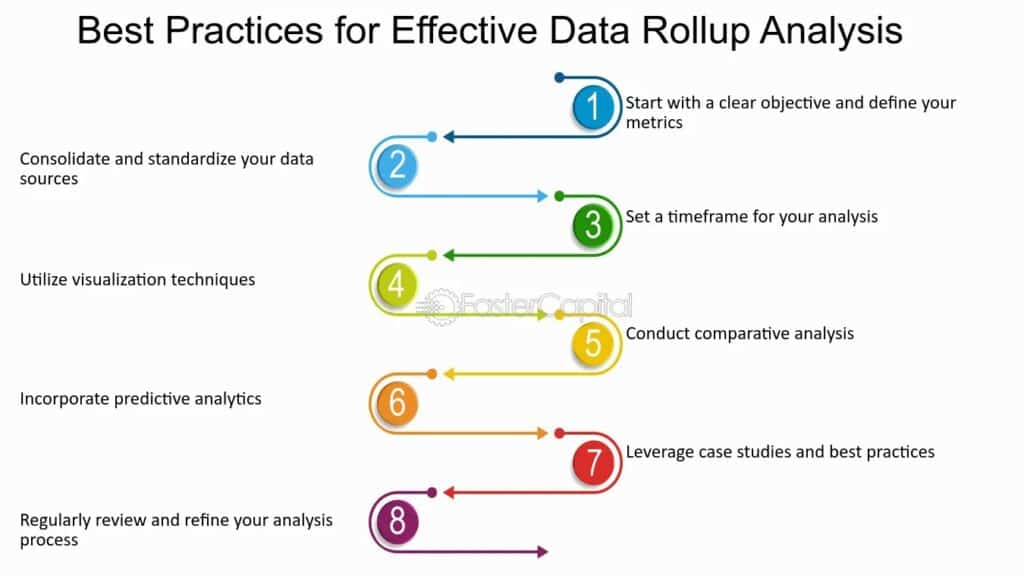
To achieve the best results in data analysis, follow these best practices:
- Ensure Data Quality: Clean and preprocess data to remove inaccuracies and inconsistencies.
- Use the Right Tools: Select tools that best suit the type of data and analysis required.
- Visualize Data: Use visualizations to make data insights more accessible and understandable.
- Collaborate: Work with cross-functional teams to gain different perspectives and insights.
- Document Processes: Keep detailed records of your data analysis processes for transparency and reproducibility.
Challenges and Solutions in Data Analysis
Despite its benefits, data analysis comes with challenges:
Common Challenges:
- Data Quality Issues: Incomplete or inaccurate data can skew analysis results.
- Complex Datasets: Large and complex datasets require advanced skills and tools.
- Data Security: Ensuring the privacy and security of data is critical.
Solutions:
- Implement Data Governance: Establish policies and procedures to maintain data quality and security.
- Invest in Training: Regularly upskill your team to keep up with the latest data analysis techniques and tools.
- Use Automated Tools: Leverage automated data cleaning and processing tools to handle large datasets efficiently.
Future Trends in Data Analysis
Data analysis is continually evolving, driven by technological advancements and changing business needs. As we look ahead, several emerging trends are poised to transform how data is utilized and interpreted, making data analysis more powerful and accessible than ever before.

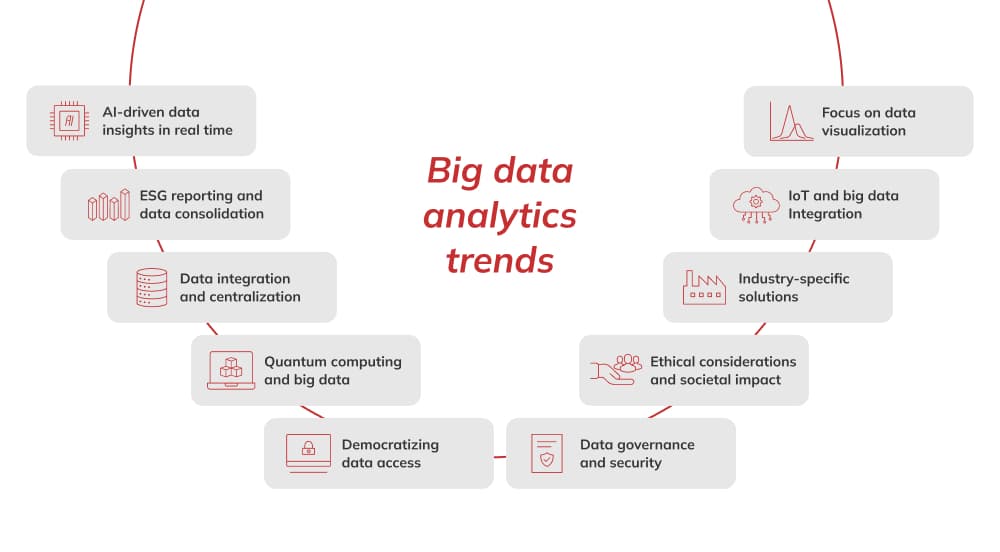
Emerging Trends:
- AI and Machine Learning Integration: Enhancing data analysis capabilities with advanced AI and machine learning algorithms.
- Real-Time Analytics: Increasing demand for real-time data processing and analysis.
- Big Data Analytics: Utilizing big data technologies to handle and analyze vast data.
- Data Democratization: Making data accessible to all stakeholders within an organization.
- Enhanced Data Visualization: Developing more sophisticated and interactive data visualization tools.
These trends indicate a future where data analysis will be more integrated, faster, and more user-friendly, enabling businesses to derive insights quickly and accurately.
FAQs
What is the most important skill for a data analyst?
The most important skill for a data analyst is the ability to interpret and analyze data accurately, combined with strong problem-solving skills.
How can I start a career in data analysis?
To start a career in data analysis, gain proficiency in data analysis tools and techniques, complete relevant courses or certifications, and build a portfolio of data analysis projects.
What are the best tools for data analysis?
The best tools for data analysis include Python, R, SQL, Tableau, and Power BI.
How does data analysis help businesses?
Data analysis helps businesses by providing insights that drive decision-making, optimizing operations, enhancing customer experiences, and increasing profitability.
What is the difference between data analysis and data analytics?
Data analysis focuses on inspecting, cleaning, and modeling data to discover useful information, while data analytics is a broader term that includes data analysis and other data-related activities like data mining and predictive modeling.


