Introduction to Descriptive Statistics
Descriptive statistics provide a simple summary of the sample and the measures. They form the foundation of quantitative data analysis by summarizing data to understand patterns, trends, and general insights. These statistics are essential for data scientists, analysts, and researchers who need to interpret and present data meaningfully.
In the world of data analytics, descriptive statistics play a vital role in the initial phase of data analysis. They help in transforming raw data into meaningful information, paving the way for further analysis and decision-making. The primary goal is to provide insights into the data’s structure, variability, and central tendencies.
Understanding Descriptive Analytics
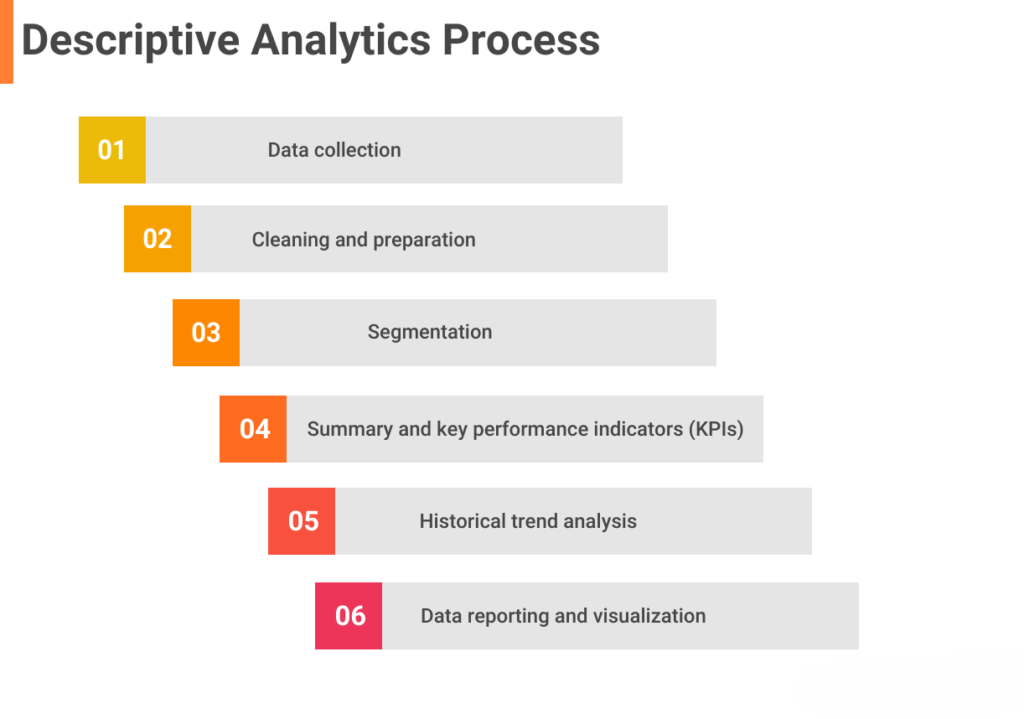
Descriptive analytics is a subset of business intelligence that focuses on understanding historical data. By leveraging descriptive statistics, descriptive analytics provides insights into past events and helps organizations comprehend what has happened in their business operations.
Key Characteristics of Descriptive Analytics:
- Data Summarization: Aggregates past data to identify patterns and trends.
- Insight Generation: Helps in interpreting data for better understanding.
- Business Intelligence: Provides foundational knowledge for business operations.
Descriptive analytics is crucial for businesses to make informed decisions based on historical data. It allows companies to learn from past performance and apply these insights to optimize current and future strategies.
Key Descriptive Statistics Measures
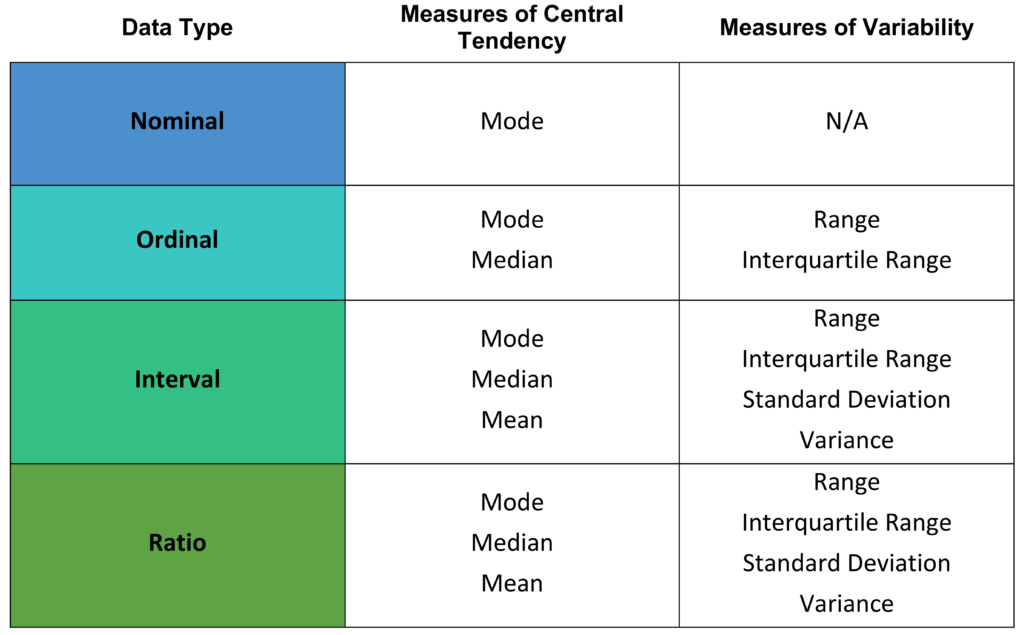
Descriptive statistics encompass various measures that summarize data features. These measures can be categorized into measures of central tendency, measures of variability, and measures of distribution shape.
Measures of Central Tendency
- Mean: The average value of a dataset.
- Median: The middle value when data points are ordered.
- Mode: The most frequently occurring value in a dataset.
These measures provide a central value around which data points cluster, offering insights into the data’s overall distribution.
Measures of Variability
- Range: The difference between the maximum and minimum values.
- Variance: The average squared deviation from the mean.
- Standard Deviation: The square root of variance, indicating data dispersion.
Variability measures provide insights into the spread and dispersion of data points, highlighting data consistency or volatility.
Measures of Distribution Shape
- Skewness: Indicates asymmetry in data distribution.
- Kurtosis: Measures the peakedness or flatness of data distribution.
Understanding the distribution shape helps identify anomalies and patterns within the data.
Descriptive Analytics Methods
Descriptive analytics methods leverage descriptive statistics to analyze historical data and uncover insights.
Data Aggregation
- Summarizing Data: Aggregating data to provide concise summaries.
- Data Grouping: Categorizing data to identify patterns.
Data Visualization
- Charts and Graphs: Utilizing visual aids to represent data insights.
- Dashboards: Interactive platforms to monitor key metrics.
Statistical Analysis
- Correlation Analysis: Exploring relationships between variables.
- Trend Analysis: Identifying trends over time.
These methods help analysts interpret data effectively, driving better decision-making.
Applications of Descriptive Statistics
Descriptive statistics have widespread applications across various fields, enabling businesses and researchers to gain valuable insights.
- Market Research: Understanding consumer behavior and preferences.
- Financial Analysis: Analyzing financial performance and trends.
- Healthcare: Monitoring patient outcomes and treatment effectiveness.
- Education: Evaluating student performance and learning outcomes.
By applying descriptive statistics, organizations can make data-driven decisions that enhance efficiency and effectiveness.
Descriptive Statistics vs. Inferential Statistics
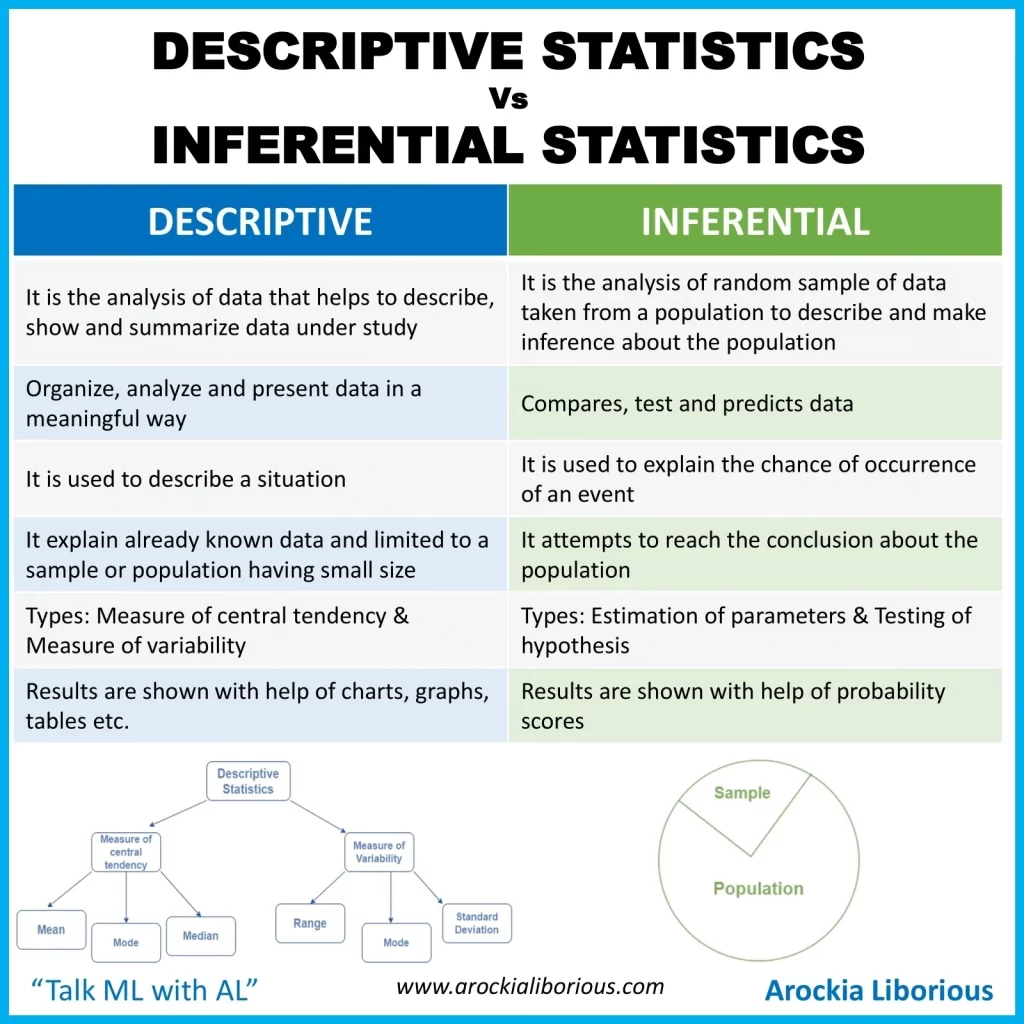
Descriptive and inferential statistics are the two main branches of statistical analysis. While both play crucial roles, they serve different purposes.
- Descriptive Statistics: Focuses on summarizing and presenting data features. It describes past events without drawing conclusions beyond the data.
- Inferential Statistics: Uses sample data to make inferences and predictions about a population. It involves hypothesis testing and estimating population parameters.
Understanding the differences between these two branches helps analysts choose the appropriate approach for their data analysis needs.
| Aspect | Descriptive Statistics | Inferential Statistics |
| Purpose | Summarize data | Make inferences |
| Scope | Limited to sample data | Extends to population |
| Methods | Central tendency, variability, distribution shape | Hypothesis testing, estimation |
| Application | Historical data analysis | Prediction and forecasting |
Tools for Descriptive Statistics
Various tools and software facilitate descriptive statistics, offering powerful features for data analysis.
- Excel: A widely used spreadsheet tool for basic descriptive statistics.
- R and Python: Programming languages with libraries like Pandas and NumPy for advanced analysis.
- Tableau: Data visualization software that enhances insights through interactive dashboards.
- SPSS and SAS: Specialized statistical software for in-depth data analysis.
These tools streamline data analysis, making it accessible to many users.
Challenges in Descriptive Analytics
Despite its advantages, descriptive analytics poses certain challenges.
- Data Quality: Ensuring accurate and reliable data for analysis.
- Data Overload: Handling large volumes of data can be overwhelming.
- Complexity: Analyzing complex datasets requires advanced skills.
Addressing these challenges requires robust data management practices and continuous improvement in analytical skills.
Conclusion
Descriptive statistics form the backbone of data analysis, offering essential insights into data patterns and trends. By leveraging descriptive analytics, businesses can make informed decisions, optimize operations, and drive growth. As data analytics evolves, mastering descriptive statistics remains a valuable skill for analysts and decision-makers.
1. What are descriptive statistics?
Descriptive statistics are numerical and graphical methods used to summarize and describe the features of a dataset.
2. How do descriptive statistics differ from inferential statistics?
Descriptive statistics summarize data without concluding, while inferential statistics use samples to make predictions about a population.
3. What tools are commonly used for descriptive statistics?
Common tools include Excel, R, Python, Tableau, SPSS, and SAS.
4. Why are descriptive statistics important in business?
Descriptive statistics help businesses understand data patterns, monitor performance, and make data-driven decisions.
5. What are the key measures of descriptive statistics?
Key measures include mean, median, mode, range, variance, standard deviation, skewness, and kurtosis.
